Introduction to multivariable functions
Domain
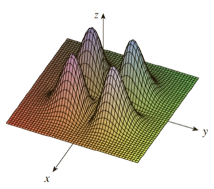
Graphs
The temperature-humidity index
(or humidex, for short) is the perceived air temperature when the actual
temperature is T and the relative humidity is
,
so we can write
.
The following table of values of
is an excerpt from a table compiled by the National Oceanic &
Atmospheric Administration. Using the table, find
.
What is the meaning of
?
| Actual temp | Relative humidity () | |||||
|---|---|---|---|---|---|---|
| (F) | 20 | 30 | 40 | 50 | 60 | 70 |
| 80 | 77 | 78 | 79 | 81 | 82 | 83 |
| 85 | 82 | 84 | 86 | 88 | 90 | 93 |
| 90 | 87 | 90 | 93 | 96 | 100 | 106 |
| 95 | 93 | 96 | 101 | 107 | 114 | 124 |
| 100 | 99 | 104 | 110 | 120 | 132 | 144 |
Let
.
(a) Evaluate
.
(b) Find and sketch the domain of .
(c) Find the range of .
Let
.
Find and describe the domain of
.
Find and sketch the domain of the function.
Find and sketch the domain of the function.
Sketch the graph of the function.
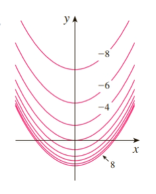
Level curves and contour maps
Make a rough sketch of a contour map for the function whose graph is shown.
A contour map of a function is shown. Use it to make a rough sketch of the graph of .
Draw a contour map of the function showing several level curves.